
 |
"the greatest strength of the human mind, its ability to perceive the surrounding world, and eliminating the greatest weakness of the human mind, its inability to estimate the dynamic consequences of even a correct set of system assumptions." (Forrester, 1971:16)
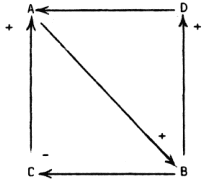
Figure 1: Example of a structural model
Figure 1 shows a simple example of a structural model, presented in the form of a directed graph or digraph. The essential variables - A,B,C and D - are presented as nodes, and significant direct relationships between the nodes as directed links. The absence of a link between any two variables
"may not always mean that there is no direct relationship but rather that any such relationship is weaker (by some orders of magnitude) than those included in the graph." (Galbraith, 1981:5)The sign of the link from variable A to variable B is positive (+) because the effect of the relationship is augmenting; that is, an increase in A wi11 lead to an increase in B and a decrease in A will lead to a decrease in B. The sign of the link from variable B to variable C is negative (-) because the effect of the relationship is inhibiting; that is, an increase in B will lead to a decrease in C and a decrease in B wi11 lead to an increase in C. Two circuits or feedback loops exist in the model, A-B-C-A which is augmenting to variable A and A-B-D-A which is inhibiting to variable A.
"an holistic view of the problem and to summarize explicitly and consistently information which varies in quality and type within the one framework." (Galbraith, 1983:41)Other advantages claimed for the process (Kornblah and Little, 1976; Roberts, 1971; Warfield, 1976) are that it can provide new and critical insights, be used to investigate 'if-then' implications, and may increase the understanding of, and communication between, interested parties.
The major limitation of the structural model is that it is essentially a linear model. McLean and Shepherd (1976:43) suggest that this is
"far from serious for the following reasons. First, most of the structural features of models are independent of the form of the functional relationship between variables. Second, most models can be reproduced in a linear form if a sufficiently small time period is selected. Furthermore, the ability to linearise a dynamic model enables one to compare and contrast structural analyses of linear snapshots of models at different times."Concern also has been expressed (Bolam, 1980; Kornbluh and Little, 1976) that the framework of a structural model is far too eclectic, thus presenting the danger of inaccurate representation or over simplification. However, Forrester (1971:3-4) counters with the argument that
"The validity and usefulness of dynamic models should be judged, not against an imaginary perfection, but in comparison with the mental and descriptive models we would otherwise use ... We should judge the models by the ease of communicating their structure compared to the difficulty in conveying a verbal description."
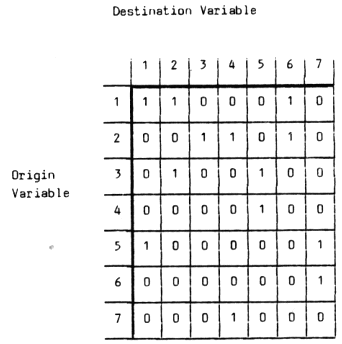
Figure 2: Hypothetical Systems Subordination Matrix
The causal relationships between system variables are most effectively communicated by converting the S.S.M. into a directed graph in which the variables are presented as nodes and direct causal relationships as directed links. This is essentially an iterative process in which the variables are transposed in an attempt to provide the clearest possible presentation of the causal links. The specific algorithm used to convert a system subordination matrix into a directed graph is described in Warfield (1976). Figure 3 shows the resulting 'causal diagram' for the hypothetical S.S.M. presented in Figure 2.
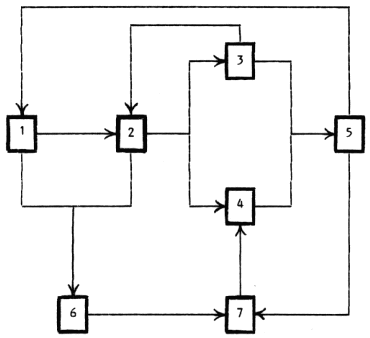
Figure 3: Causal Diagram
The causal model can be made more effective by determining whether the effect of each causal relationship is augmenting or inhibiting to the level of the destination variable. This task can not be performed satisfactorily on the directed graph because its links are often shared pathways for originating nodes that have opposing influences on common destination variables. The procedure generally adopted involves assigning a '+' to each causal relationship on the S.S.M. identified as augmenting, and a '-' to each causal relationship on the S.S.M. identified as inhibiting (Figure 4). For ease of communication to the reader, the resulting matrix form of this 'structural model' has been converted into the directed graph shown in Figure 5.
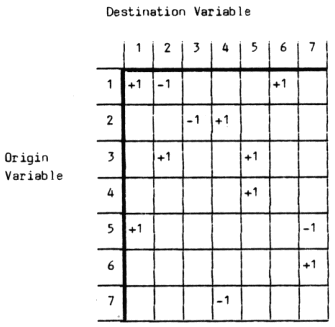
Figure 4: Signed Systems Subordination Matrix
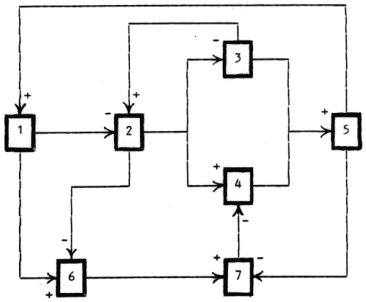
Figure 5: The Structural Model
A signed digraph such as Figure 5 incorporates the simplifying assumption that the strengths of all model links are the same. In reality, the effect of some relationships will be stronger than others. It follows that a more meaningful representation of the problem will be obtained by placing relative numerical values on the directed links of the model in order to convey their operative potency. The lack of precise data relating to many aspects of most complex issues and problems means that a weighting system based on an interval scale is generally not appropriate. The author suggests the approach of Saaty and Vargas (1981) that uses the following 9-point ordinal scale to convey the relative influence of each signed, directed link in a structural model:
| 9 - Very strong influence |
| 8 |
| 7 - Strong influence |
| 6 |
| 5 - Moderate influence |
| 4 |
| 3 - Weak influence |
| 2 |
| 1 - Very weak influence |
The even numbers of the scale - 2,4,6 and 8 - represent intermediate assessments between two adjacent judgment categories. Figure 6 shows an example of a signed, weighted matrix model.
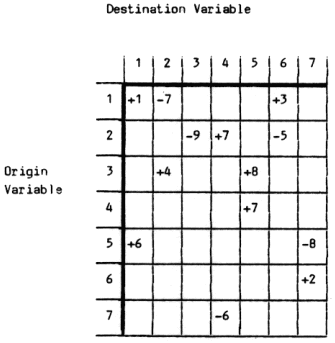
Figure 6: Weighted Systems Subordination Matrix
Forrester, J.W. (1968) Principles of Systems Cambridge, Massachusetts : Wright - Allen.
Forrester, J.W. (1971) World Dynamics Cambridge, Massachusetts : Wright - Allen.
Galbraith, P.L. (1981) "Future For Higher Education in Australia : A simulation approach." Paper presented at the ANZAAS Conference, Brisbane.
Galbraith, P.L. (1983) "Forecasting Futures for Australian Higher Education : An Application of Dynamic Modelling." Unpublished Doctoral Thesis, University of Queensland.
Kornbluh, M. and Little, D. (1976) "The Nature of a Computer Simulation Model" Technological Forecasting and Social Change No. 9, pp 3-26.
McLean, J.M. and Shepherd, P. (1976) "Importance of Model Structure" Futures February, pp 40-51.
Randers, J. (1973) "Conceptual Dynamic Models of Social Systems". Unpublished Ph.D. Thesis, Massachusetts Institute of Technology.
Roberts, F.S. (1971) Signed Digraphs and the Growing Demand for Energy Santa Monica, California : RAND Report R-756-NSF.
Saaty, T.L. and Vargas, L.G. (1981) The Logic of Priorities Boston : Kluwer - Nijhoff.
Smith, L.R. (1985) "An Investigation into the Factors Influencing In-service Sponsorship and Support in the Traditional Independent Schools of Queensland, and the Mechanism by which they Operate." Unpublished Ph.D. Thesis, University of Queensland.
Warfield, J.N. (1974) "Structuring Complex Systems" Battelle Monograph No. 4.
Warfield, J.N. (1976) Societal Systems New York : Wiley - Interscience.
| Please cite as: Smith, L. (1986). An introduction to structural modelling. Queensland Researcher, 2(3), 12-23. http://www.iier.org.au/qjer/qr2/smith.html |