The impact of interactive multimedia on kindergarten students' representations of fractions
Kristy Goodwin
Macquarie University
This paper reports initial findings from an intervention study evaluating the affordances of a variety of interactive multimedia tools on kindergarten students' representations of fractions. The study engaged 21 kindergarten students in a whole-class technology-based mathematics intervention conducted over 12 weekly teaching episodes. A comparison group of a parallel kindergarten class of 22 students maintained their regular mathematics program. Dynamic visual tools, including the interactive whiteboard (IWB), digital learning objects (DLOs), interactive CDs and 'constructive' software were utilised by the intervention class to promote concept development. The intervention students' pre- and post-intervention drawings indicated substantial growth in cognitive infrastructure and symbolic notations. Qualitative analyses of the intervention students' digital screen recordings and drawings provided complementary evidence of more advanced, flexible and alternative representations of fraction concepts than those displayed by the comparison group.
There has been a recent surge in published research on IWBs, with most studies being conducted in the United Kingdom, where there has been a significant fiscal investment in ICT infrastructure by the government. However, the results are inconclusive and at times, contradictory. Some studies have reported gains in students' attainment scores when using IWBs (Balanskat et al., 2006; Becta Research Reviews, 2003; White, 2007) and increased student motivation and engagement in learning (Hunter & Beveridge, 2006; Miller, 2005). Other empirical evidence pertaining to the impact of IWBs on student attainment has produced conflicting evidence: an analysis of student attainment data revealed no evidence of any impact, positive or negative, of IWBs on achievement (Moss, Jewitt, Levaaic, Armstrong, Cardini, & Castle, 2007). Not surprisingly, Moss and others (2007) call for further research to examine the use of IWBs to explain their impact on student learning.
Recent, independent Australian research examining the combined use of IWBs and DLOs with primary and secondary students suggests that these technological tools can facilitate and enhance the learning of concepts (Hedberg & Freebody, 2007). Teachers in the aforementioned study reported that students acquired concepts at a faster rate and had fewer conceptual difficulties, attributing this to more flexible representational modalities offered through the combined use of IWBs and DLOs. It is possible that displaying and discussing mathematical representations embedded within interactive multimedia may enhance students' learning outcomes. Yet the existing corpus of research on educational technology has not examined how young students use technological tools such as IWBs or interactive multimedia, and the subsequent impact on their cognitive infrastructure. This study attempts to address this gap in the research.
Increasing technological sophistication, coupled with the increasing provision of technological infrastructure, demands systematic, classroom-based research to substantiate their impact on teaching and learning. Research needs to determine the extent to which young students attribute meaning to the visual on-screen representations and how they assimilate these into their existing mathematical understandings.
Technology permeates most young children's daily lives and social milieu. Research conducted by the Australian Communications and Media Authority (Rutherford & Bittman, 2007) reported that technology and media devices are ubiquitous in Australian families with almost all families having a computer and DVD player and nine in 10 families having internet access. This report claims that there is a prominence of digital media in young children's leisure activities (Rutherford & Bittman, 2007). When using digital technologies young students may encounter representations of rational numbers such as percentages, fractions and ratios displayed on computer download bars, iPods and volume controls (Moss & Case, 1999). Hence, representations of fractions are changing from concrete, static representations, to more dynamic models. It throws into question the currency and relevance of traditional models of fractions which have permeated instruction and dominated text-book examples: such as pre-partitioned two-dimensional shapes (Watanabe, 2002). As well as static representations commonly found in text-books and syllabi, teachers and students can now utilise an array of dynamic, digital representations provided by multimedia tools. In this paper, the term 'multimedia' refers to the multiple representational formats such as audio, graphics, animations and text to present an instructional message (Mayer, 2001). Through the presentation and construction of these representations, students' mathematical concepts can be conveyed in new ways. These abstract concepts, previously deemed too difficult for young students to learn, can now be more easily presented or generated. Further, the use of such tools affords students the opportunity to more easily engage in systematic and sustained experimentation of mathematical representations, than possible with traditional, inert media.
All technological tools were initially presented to the students using the IWB and were then subsequently explored by the students using the individual personal computers in the computer laboratory. Plenary sessions utilised the IWB, where student work samples and pertinent student discoveries that resulted from incidents of cognitive dissonance, were shared with the whole class. This promoted mathematical discourse.
 |
 |
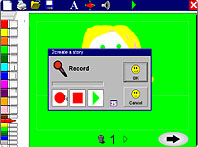 |
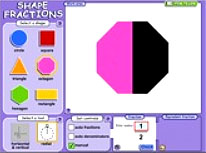
| Figure 1: A screenshot of instructive multimedia titled Feed the Fantastic Fraction Flamingo (Galaxy Kids Maths CD- Purple/Gold, 2005) | Figure 2: A screenshot of manipulable, constructive multimedia titled Shape Fractions Learning Object (The Learning Federation, 2007) | Figure 3: A screenshot of constructive multimedia titled 2 Create a Story (2 Simple, 2006) |
The cognitive impact of a variety of multimedia tools was measured by students' retrieval and depiction of mental referents, manifested by their drawings and multimedia artefacts. Drawing techniques have been used with young students to ascertain their intuitive concept image of various mathematical ideas (Gould, 2005; Gould, Outhred, & Mitchelmore, 2006; Papic & Mulligan, 2007; Thomas, Mulligan, & Goldin, 2002). Student drawings provided representational insight into students' mental models providing evidence of the structural development of their representations (Biggs & Collis, 1982).
Students in both classes were required to draw a picture in response to the question 'What is the first thing that comes into your mind when you think of a fraction?' This assessment was complemented with a drawing task included in the Early Digital Fraction Assessment (EDFA) (Goodwin, 2008). The EDFA was a curriculum-referenced, multimedia assessment device, developed by the researcher, in consultation with a team of mathematics educators and experienced classroom practitioners. These pre-and post-intervention assessments were administered in a whole-class setting, but completed individually by all students. These spontaneous representations provided qualitative evidence of the students' internal representations of fractions, as an indicator of any changes that may have occurred to their cognitive infrastructure throughout the intervention period.
The analysis of student drawings involved the coding of responses according to specific criterion previously developed by the researcher in iteration one. The coding framework is based on the earlier work of using the Structure of Observed Learning Outcomes taxonomy (SOLO) (Biggs & Collis, 1982) and the work of Watson and colleagues (Watson et al., 1999). More recent applications of this framework include new analyses of structural development in early mathematical concepts (Thomas et al., 2002). A revised code was assigned to each drawing according to amalgamated levels of mathematical, representational and symbolic development. Nine categories were established, with the drawings becoming increasingly more sophisticated in terms of structural development: containing more complex mathematical understandings, appropriate representations and more detailed and accurate use of formal symbol notation. The levels are described in Table 1. The coding was independently verified by two separate coders, with inter-coder reliability calculated at 95% and 98% respectively.
| Level of Development | Description | Student Example |
| 0. No response | Children gave no response to the task. Students at this stage may have a conceptual understanding of fractions, but were unable to draw or articulate this understanding. | N/a |
| 1. Pre-structural, iconic stage | Pictorial, episodic representations of animate and inanimate objects, persons or events. A non-mathematical concept image of a fraction, without evidence of equal-sized units, symmetry, or part of a group. No symbol notation. |  |
| 2. Uni-structural, invented-symbolic stage | Adherence to one concept image of a fraction. Superfluous, surface characteristics included in static representations. Partitioned 3D animate and inanimate objects and inanimate 2D shapes. Invented, non-formal symbol notation. | 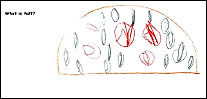 |
| 3. Uni-structural, emergent symbolic stage | Students adhere to one representation of a half using inanimate objects (2D shapes) partitioned with vertical and non-vertical partitions. Units of equal size or equal sized groupings are used to depict half of a whole or half of a collection of objects. Incorrect attempts are made to use formal symbol notation. | 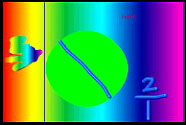 |
| 4. Multi-structural, formal symbolic stage | Students generate representations of half and a quarter of inanimate objects and collections of objects. Students assign corresponding symbol notation to representations in the form of a/b. | 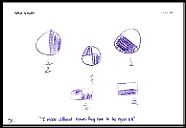 |
| 5. Multi-structural unit fraction, multi-representational, symbolic stage | Students generate multiple representations of a variety of unit fractions, beyond halving and quarters. 'Non-schooled' representations may be present. Students assign correct symbol notation in the form a/b. | 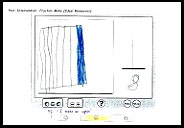 |
| 6. Multi-structural, non-unit fraction, symbolic stage | Students can generate multiple representations of a variety of non-unit fractions and assign correct symbol notation in the form a/b. | 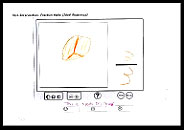 |
| 7. Multi-structural, comparative stage | Students can recognise a range of simple equivalent fractions and can compare the size of two unit fractions. |  |
| 8. Abstraction stage | Students can generalise the fraction concept to new situations, beyond what has been dealt with in the teaching and learning episodes. Students go beyond mimicking imposed representations, generating exemplar, prototypical images. | N/a - contingent upon each student's learning experiences |
The second phase of analysis involved a fine-grained analysis of the intervention students' artefacts generated throughout the intervention period. Analysis of students' drawings and screen recordings of computer work, collected throughout the intervention period were analysed. The drawn representations were analysed using the above-mentioned coding framework and a qualitative exploration of the mathematical, representational and symbolic characteristics embedded within the drawings. The screen recordings comprised audio and visual data captured during students' work with the personal computers. Video analysis software, StudioCode, was used to 'tag' key incidents in the screen recording data and provided subsequent quantitative data. This data provided evidence to conjecture the ways in which the technological intervention impacted on the intervention students' cognitive infrastructure.
Prior to the intervention 14% of students in the intervention class were classified as having a pre-structural, iconic concept image of a fraction, as shown in Figure 4. These drawings were characterised by idiosyncratic features, lacking evidence of structure or symmetry and revealing a non-mathematical concept image of a fraction. However, the remaining 86% gave uni-structural responses as evidenced by their depiction of a half as a partitioned inanimate object. Students operating at this stage of development experimented with mathematical symbol notation in the form of the addition symbol or emergent numerals. In contrast, 86% of the non-intervention class were considered to have a pre-structural concept image of a fraction. The other 14% of students showed uni-structural responses. However, there were few attempts to use experimental symbol notation.
Figure 4: Classification of students' concept image of a fraction
The post-intervention categorisation of data also revealed stark differences in the levels of mathematical, representational and symbolic development between the two cohorts (see Figure 4). Non-intervention students' levels of response remained unchanged with 41% of students' post-intervention drawings scoring the same as their pre-intervention drawings. While 32% of the non-intervention students showed advancement in their drawn response, 27% of the non-intervention class' responses were less advanced than at their earlier assessment. The intervention class made significant gains in terms of their mathematical, representational and symbolic development, with all students' responses showing growth. All students in the intervention class advanced in the post-intervention assessment. The majority of the class (61%) was able to generate multi-structural representations of fractions which included depictions of halves and quarters with corresponding symbol notation. A further 10% of the intervention class was able to depict unit fractions such as one-third or one-tenth and annotate with the correct symbol notation and an additional 10% was able to represent and label non-unit fractions such as two-quarters and three-sixths.
Further, the intervention students' post-intervention drawings demonstrated that they had developed more robust and accurate concept images of fractions with increased use of symbol notation, than their pre-intervention drawing. Many students could also depict multiple representations of fractions, as evidenced by Figures 5 and 6. In contrast, most students in the non-intervention class adhered to one concept image after the intervention period, as shown in Figures 7 and 8. Despite formal instruction addressing halves and quarters, 73% of the non-intervention class' drawings were at a pre-structural level after the intervention period and imbued with non-mathematical, episodic features. Post-intervention representations were dominated by idiosyncratic, animate and inanimate depictions, devoid of mathematical or symbolic features.
| Class | Pre-intervention drawing | Post-intervention drawing |
| Intervention | 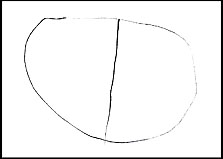 | 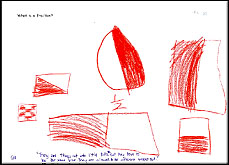 |
| Figure 5: S4's pre-intervention drawing of a fraction | Figure 6: S4's post-intervention drawing of a fraction | |
| Non-Intervention |  | 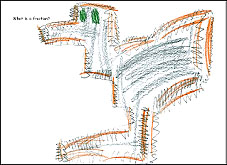 |
| Figure 7: S1's pre-intervention drawing of a fraction | Figure 8: S1's post-intervention drawing of a fraction |
Both student drawings and digital screen recordings showed the emergence of alternative, 'non-traditional', 'non-schooled' representations. These were apparent only in the intervention class, as evidenced by Figures 9 and 10. Such representations were not evident in the non-intervention class. Live screen recordings revealed that the frequency and nature of the dynamic on-screen representations and ease of manipulation, afforded by the interactive multimedia tools, facilitated the development of these 'non-schooled' representations. After receiving successive, positive feedback to signal a correct depiction of a fraction, the students acknowledged that they had generated a legitimate, albeit 'different', representation of a fraction. Such representations deviate from traditional representations of fractions where a 2D shape is partitioned into equal pieces and a whole, consecutive surface area is covered to represent a fraction. Instead, the 'non-schooled' representations were characterised by a checkerboard or alternate colouring pattern. These non-schooled representations signal a more advanced understanding of a half.
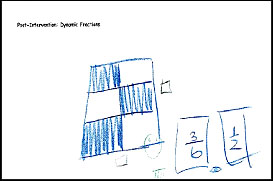 | 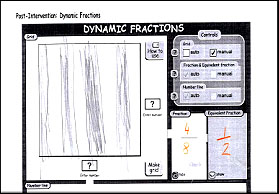 |
| Figure 9: S8's recalled image and explanation after using a DLO (manipulable, constructive multimedia | Figure 10: S3's recalled image after using an interactive CD titled 'Ideal Resources' (manipulable, constructive multimedia |
A closer analysis of student drawings and screen recordings from the intervention class suggests that traditional learning trajectories, as advocated by current Mathematics syllabus documents (Board of Studies, 2002), were altered when employing technological tools. Whilst kindergarten students are not expected to be adept at using symbol notation, nor at recognising quarters, the majority of the intervention class demonstrated proficiency in these areas. In addition, some of these students also depicted mathematical concepts not typically expected in kindergarten: equivalent fractions and unit and non-unit fractions by using various multimedia tools (as Figures 9 and 10 exemplify). The intervention class' drawings exceed current NSW curriculum guidelines that state that kindergarten students need to "Describe halves, encountered in everyday contexts, as two equal parts of an object" (Board of Studies, 2002, p.60). These achievements suggest that young students' learning outcomes were accelerated when using multimedia tools as Kindergarten students are not expected to encounter such content for at least another three chronological years in a 'typical' developmental progression.
The screen recordings revealed that the intervention students received instantaneous feedback with some multimedia applications, enabling them to develop complex fraction concepts and rectify any misconceptions. With static representations used in text-books, delayed feedback is common and this allows for the perpetuation of students' misconceptions. With some multimedia tools, such as the drill-and-practice CDs and DLOs, students were provided with instantaneous feedback, which forced them to reconcile any moments of cognitive dissonance, where a screen enactment differed from their fore-conceptions. The screen recordings revealed that many of the students assimilated the feedback into their subsequent attempts and were pleased to achieve a correct response. In addition to the provision of feedback, some multimedia tools afforded the students the opportunity to easily manipulate the on-screen representation and observe the dynamic, corresponding changes. In particular, the dynamic, manipulable representational tools, such as the DLOs, enabled easy manipulation of representations of fractions, compensating for the young students' emerging fine motor skills. Screen recordings revealed that many students assimilated the computer feedback and dynamic fraction models presented on-screen into their concept image of a fraction, as exemplified by their subsequent drawings. The immediacy of the feedback provided by the multimedia tools allowed for a quicker pace of learning than traditional, inert representations and may account for the differences in the post-intervention responses between the two classes.
Screen analysis also provided evidence that the intervention class were exposed to a significant number of representations, when using particular multimedia tools. Analysis of screen recordings from the use of a DLO entitled Shape Fractions (The Le@rning Federation, 2007) showed that the average number of fraction representations generated and manipulated on-screen in a one-minute excerpt was six representations. This in turn exposed them to a greater number of representations than they would have likely encountered with static media. Given their emerging dexterity, it would be unlikely that young students would be able to generate a similar quantity of representations if using static media or physical manipulatives. This may explain the differences in post-intervention responses between the two cohorts of students.
Overall, the results indicated that there is merit in the combined use of IWBs and interactive multimedia, with young students. The results suggest that interactive tools support the cognitive apparatus of young learners, some tools more effectively than others. The intervention class used a plethora of interactive multimedia tools and developed robust and more formal concept images of fractions. Student drawings revealed that there were significant differences between the two classes in terms of the pre- and post-intervention responses: the intervention students outperformed the comparison class after the intervention in terms of the structure of their internal image configurations. The analysis of the intervention students' drawings and screen recordings provides descriptive evidence of changes in students' representations and possible explanations as to how and why the interactive multimedia impacted on learning outcomes. This study has established that digital technologies, such as those enacted in the intervention, can provide unique learning opportunities for young students. The preliminary analysis reveals that multimedia tools afforded the intervention students the opportunity to engage with advanced mathematical ideas that exceed current, teaching practices and syllabus requirements. As a result, these findings have ramifications for curriculum and software designers who develop and espouse learning outcomes and activities for young students.
Balanskat, A., Blamire, R. & Kefla, S. (2006). The ICT impact report: A review of studies of ICT impact on schools in Europe. European Communities. http://ec.europa.eu/education/pdf/doc254_en.pdf
Becta Research Reviews (2003). What research says about interactive whiteboards. BECTA. http://partners.becta.org.uk/upload-dir/downloads/page_documents/research/wtrs_whiteboards.pdf
Behr, M. J., Lesh, R., Post, T. R., & Silver, E. A. (1988). Rational number concepts. In R. L. M. Laudau (Ed.), Acquisition of mathematics concepts and processes (pp. 91-126). New York: Academic Press.
Behr, M. J. & Post, T. (1988). Teaching rational number and decimal concepts. In T. R. Post (Ed.), Teaching mathematics in grades K-8 (pp. 109-231). Boston: Allyn and Bacon, Inc.
Biggs, J. B. & Collis, K. F. (1982). Evaluating the quality of learning - the SOLO taxonomy. New York: Academic Press
Board of Studies (2002). Mathematics K-6 Syllabus 2002. Sydney: Author.
Cobb, P., Yackel, E. & Wood, T. (1992). A constructivist alternative to the representational view of mind in mathematics education. Journal for Research in Mathematics Education, 23(1), 2-33.
Cox, M., Webb, M., Abbott, C., Blakeley, B., Beauchamp, T. & Rhodes, V. (2003). ICT and attainment: A review of the research literature (No. 17). London: Becta. http://partners.becta.org.uk/upload-dir/downloads/page_documents/research/ict_attainment_summary.pdf
Empson, S. B. (2003). Low-performance students and teaching fractions for understanding: An interactional analysis. Journal for Research on Mathematics Education, 34(4), 305-343.
Ferguson, D. (2001). Technology in a constructivist classroom. Information Technology in Childhood Education Annual, 45-55.
Goldin, G. A. & Shyeingold, N. (2001). Systems of representations and the development of mathematical concepts. In The Roles of representation in school mathematics: 2001 yearbook (pp. 1-24). Reston, VA: National Council of Teachers of Mathematics.
Goodwin, K. (2008). The development of a digital assessment of early fraction learning. In O. Figueras, J.L. Cortina, S. Alatorre, T. Rojano & A. Sepulveda (Eds.), International Group for the Psychology of Mathematics Education (Vol. 1, pp. 263). Morelia, Mexico: PME.
Gould, P. (2005). Year 6 students' methods of comparing the size of fractions. In P. Clarkson, A. Downton, D. Gronn, A. McDonough, R. Pierce & A. Roche (Eds.), Building connections: Theory, research and practice (Proceedings of the 28th annual conference of the Mathematics Education Research Group of Australasia) (Vol. 2, pp. 393-400). Melbourne: MERGA.
Gould, P., Outhred, L. & Mitchelmore, M. C. (2006). One-third is three-quarters of one-half. In P. Grootenboer, R. Zevenbergen & M. Chinnappan. (Eds.), Identities, cultures and learning spaces (Proceedings of the 29th annual conference of the Mathematics Education Research Group of Australasia) (Vol. 1, pp. 262-269). Adelaide: MERGA.
Hedberg, J. G. & Freebody, K. (2007). Towards a disruptive pedagogy: Classroom practices that combine interactive whiteboards with TLF content. http://www.thelearningfederation.edu.au/verve/_resources/towards_a_disruptive_pedagogy.pdf
Hoyles, C. & Noss, R. (2003). What can digital technologies take from and bring to research in mathematics education? In A.J. Bishop, M.A. Clements, C. Keitel, J. Kilpatrick & F.K.S. Leung (Eds.), Second International Handbook of Mathematics Education (pp. 323- 349). Dordrecht: Kluwer Academic.
Hunter, J. L. & Beveridge, S. (2006). Equation: digital resources + interactive whieboards + collaborative tools = transformative pedagogy for the classroom. Proceedings Australian Association for Research in Education Conference 2006. http://www.aare.edu.au/06pap/hun06812.pdf
Ideal Resources. (2005). Ideal Resources - Maths Pack 1: Ideal Resources.
Inspiration Software Incorporated. (2005). Kidspiration 2.1. Beaverton, Orlando: Inspiration Software.
Laborde, C., Kynigos, C., Hollebrands, K. & Strasser, R. (2006). Teaching and learning geometry with technology. In A. Gutierrez & P. Boero (Eds.), Handbook of research on the psychology of mathematics education: Past, present and future (pp. 275-304). Rotterdam, The Netherlands: Sense Publishers.
Mack, N. K. (1995). Confounding whole-number and fraction concepts when building on informal knowledge. Journal of Mathematical Behavior, 26(5), 422-441.
Mayer, R. E. (2001). Multi-media learning. Cambridge: Cambridge University Press.
Miller, D., Glover, D., Door, V. & Averis, D. (2005). How can the use of an interactive whiteboard enhance the nature of teaching and learning in secondary mathematics and modern foreign languages? London: BECTA. http://partners.becta.org.uk/upload-dir/downloads/page_documents/research/bursaries05/interactive_whiteboard.doc
Moses, A. (2007). Schools to install digital whiteboards. The Age, 18 June. http://www.theage.com.au/news/technology/schools-to-install-digital-whiteboards/2007/06/18/1182019011079.html
Moss, G., Jewitt, C., Levaaic, R., Armstrong, V., Cardini, A. & Castle, F. (2007). The interactive whiteboards, pedagogy and pupil performance evaluation: An evaluation of the schools whiteboard expansion (SWE) project: London challenge. London: Department for Education and Skills. http://www.dcsf.gov.uk/research/data/uploadfiles/RR816.pdf
Moss, J. & Case, R. (1999). Developing children's understanding of the rational numbers: A new model and an experimental curriculum. Journal for Research in Mathematics Education, 30, 122-147.
New South Wales Department of Education and Training (2006). Fractions learning objects. [viewed 1 July 2007]
http://www.curriculumsupport.education.nsw.gov.au/primary/mathematics/k6/programming/
program_support/prog_support/prog_support/fractions/fract_learnobj.html
Papic, M. & Mulligan, J. T. (2007). The growth of early mathematical patterning: An intervention study. In K. Beswick & J. Watson (Eds.), Mathematics essential research, essential practice (Vol. 2, pp. 591-600). Hobart: MERGA.
Rutherford, L., & Bittman, M. (2007). Media and communications in Australian families 2007. Melbourne, Victoria: Australian Communications and Media Authority.
Sunshine Multimedia (2005). Galaxy Kids Maths CD. Sunshine Books Australia and New Zealand.
The Le@rning Federation (2007). The Le@rning Federation. Retrieved 1 April, 2008, from http://www.thelearningfederation.edu.au/for_teachers/for_teachers_intro.html
The Learning Company (2005). Kid Pix Deluxe 4 (Version 4): The Learning Company.
The Learning Federation (2007). Mathematics and numeracy. [viewed 21 July 2007at http://www.thelearningfederation.edu.au/tlf2/showMe.asp?nodeID=75; verified 22 Nov 2008 at http://www.thelearningfederation.edu.au/verve/_resources/maths_index_oct_08.pdf ]
Thomas, N. D., Mulligan, J. T. & Goldin, G. A. (2002). Children's representation and structural development of the counting sequence 1-100. Journal of Mathematical Behavior, 21(1), 117-133.
Watanabe, T. (2002). Representations in teaching and learning fractions. Teaching Children Mathematics, (April), 457-463.
Watson, J., Campbell, J. K. & Collis, K. F. (1999). The structural development of the concept of fraction by young children. Journal of Structural Learning and Intelligent Systems, 13(3-4), 171-193.
White, K. (2007). Interactive Whiteboard Trial, South Western Sydney Region: A report. Centre for Learning Innovation, New South Wales Department of Education and Training.
| Authors: Kristy Goodwin is a PhD candidate at Macquarie University, in the Centre for Research in Mathematics, Science Education (CRiMSE). She has eight years of teaching experience, predominantly in the early years of formal schooling and a particular interest in integrating digital technologies into the curriculum.
Email: kristygoodwin@mac.com
Please cite as: Goodwin, K. (2008). The impact of interactive multimedia on kindergarten students' representations of fractions. Issues In Educational Research, 18(2), 103-117. http://www.iier.org.au/iier18/goodwin.html |